Distribution shapes
Market Profile charts, provide a way to visualize price distribution over time in a financial market. They help traders understand the market's structure, behaviour, and potential areas of interest.
As simple as this sounds, I find many price action traders get this simple concept wrong when utilising profiling tools. Many traders get lost in the sauce of using POC, VAH, and VAL as these rigid support/resistance levels. They are not. They are statistical levels based on market activity, without value the key to using profiles is understanding the different shapes the distributions form and how it reflects the establishment of fair value.
Here are some distribution shapes commonly observed on a TPO chart:
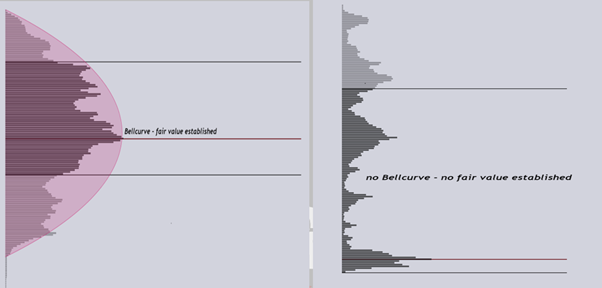
Normal Distribution (Bell Curve):
Shape: Symmetrical and bell-shaped.
Indicative of a balanced market where buying and selling pressures are roughly equal. The majority of trading activity occurs near the point of control (POC), with activity tapering off towards the extremes.
Suggests that the market is in equilibrium, with no significant imbalance in buying or selling.
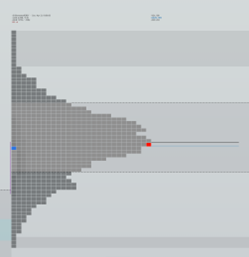
Normal Variation Distribution:
Shape: Similar to a normal distribution but slightly skewed to one side.
Most of the trading activity is concentrated around the POC, but there is a noticeable tail on one side indicating imbalanced intentions.
Indicates that while the market is generally balanced, there is a slight bias towards buying or selling pressure.
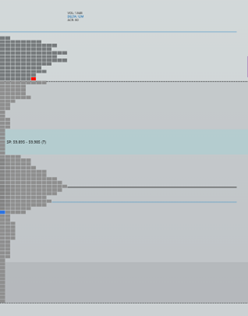
Double Distribution:
Shape: Two distinct peaks or bell curves.
The market has two prominent areas of activity separated by a low-volume area.
Suggests a market in transition, often indicating a change in sentiment or a reaction to news/events. Traders might be waiting for confirmation before committing to a direction.
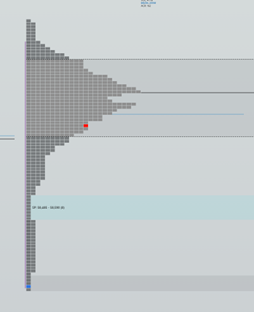
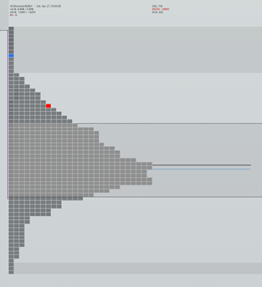
P-shaped:
Shape: Resembles the letter "P".
Characteristics: A long tail at the bottom with a bulk of activity near the top.
Indicates a strong upward move followed by consolidation. It often occurs after a period of strong buying interest or short-covering rally.
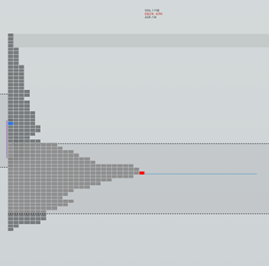
b-shaped:
Shape: Resembles the letter "b".
A long tail at the top with a bulk of activity near the bottom.
Indicates a strong downward move followed by consolidation. It often occurs after a period of strong selling interest or long liquidation.
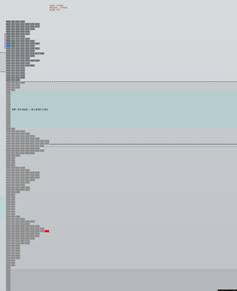
Trending Distribution:
Shape: Elongated with a single, prominent direction.
The profile is stretched out, with price moving consistently in one direction (either up or down) without much consolidation, multiple LVNs and SSAs present.
Indicates a strong trending market. Traders can expect continuation in the direction of the trend until significant resistance or support is encountered.