Fundamental Principles
1. Supply and Demand
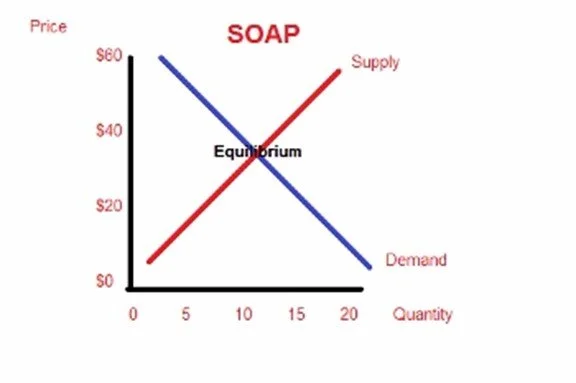
The market is constantly seeking equilibrium between supply and demand. When supply equals demand, the market is in balance, often represented by a bell-shaped profile. Imbalance occurs when supply exceeds demand or vice versa, leading to directional moves. Remember regardless of thoughts and feeling, ultimately it is supply and demand that moves the market.
There is only balance. The question is always what signs we might expect this balance to be lost and what signs might we remain balanced. If in balance expect even rotational behaviour. if not expect imbalanced trending behaviour.
2. Market Participants
The interaction between various market participants (e.g., retail traders, institutional traders, market makers) influences market dynamics. Their collective behaviour creates the patterns observed in TPO charts.
Different timeframes of traders (short-term, long-term) generally have different intentions in the market, the disparity between timeframe can contribute to skewed market behaviour. Short-term traders might react to immediate price changes, while long-term traders focus on broader value areas.
3. Price
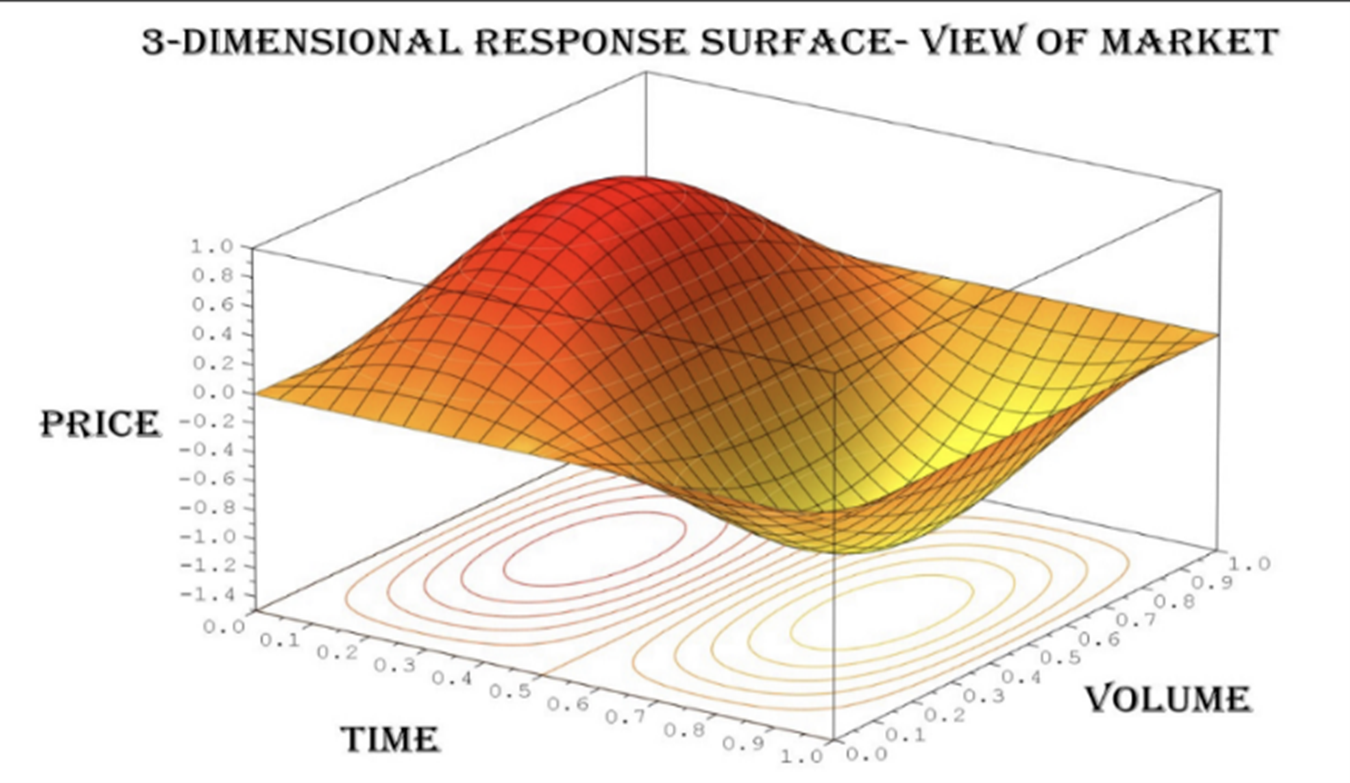
The market continuously searches for efficiency, “balance”. In other words it seeks to advertise price levels that attract the most trading activity. This process is visible in the formation and structure of Market Profiles.
4. Time
Prices where the market spends more time pose a thesis for fair value or accepted prices, often forming the Time Point of Control (TPOC) in a TPO chart. When met with high volume a consensus for value has been established for that session.
When the market spends little time at a price level, it indicates rejection. These areas often form single prints in a TPO chart, indicating that prices quickly moved away from these levels due to lack of interest.
5. Volume
Increased volume at certain price levels signifies strong interest and can confirm value hypothesis or accepted prices (More on this later). Low volume areas, conversely, indicate price levels where market participants showed little interest, often referred to as low volume nodes (LVN).